

Make the Most Out of 5 Underused Google Analytics Reports
Make the Most Out of 5 Underused Google Analytics Reports
The new Google Analytics interface is full of resources. Find out 5 reports you might have overlooked

The new Google Analytics interface is full of resources. Find out 5 reports you might have overlooked
These 5 Google Analytics reports are essential for deeper site data insights.
Internal Site Search Report
All Referral Path Report
Error Page Report
The Map Overlay
Site Speed Report
1.See What Your Users Are Looking For with Internal Site Search
Internal site search data is a great place to see exactly what our customers are looking for. Use the Site Search Usage report (found under Behavior -> Site Search) to find out how many visits included search activity.
To find out what people were looking for, look at the Search Terms report (use the terms as ideas for marketing, advertising, insights articles).
Are visitors satisfied with what they find? % Search Exits tells you the percentage of searches for which the visitor left the site after searching.
You can also see internal site search leading to a goal completion such as a transaction.
2. See Who is Linking to You with the All Referral Report
The All Referral Acquitisition Report, found under Acquisitions > All Referrals, shows who is bringing customers to your site and how valuable they are. It is also possible to see the specific page from where your site was accessed when clicking on one of the source URLs.
Find the website you are interested in and click on it.

This can be used to see what blogs and articles are linking to you, to use the info for social media marketing and brand management. Please note that the full referring URL may not be available for websites that rely on parameters, such as Facebook.
3. Identify Differences Overtime with the Map Overlay Report
The Map Overlay Report is very useful when comparing different time periods. It is very easy to see if a specific metric changed across the globe from month to month.
In the example below, we can see that there was a significant increase in Per Visit Value (Revenue / Visits) in New Hampshire compared to last year.
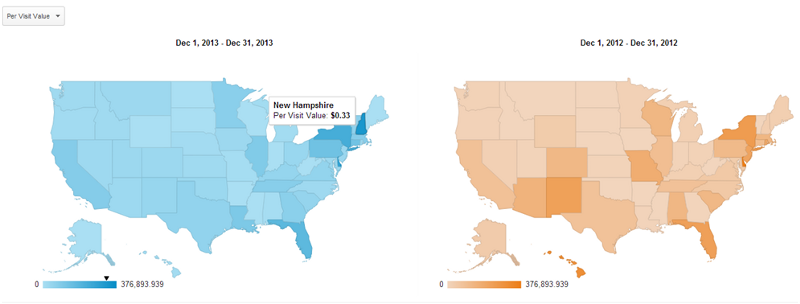
Go to Audience -> Geo -> Location and choose two time periods to compare. Then choose a metric (Visits, Revenue, Transactions) from the drop down on the top left.
4. Reduce Site Errors with the Error Page Report
Google Analytics keeps track of the errors pages which the users see, such as 404 pages or “The page cannot be found.”
Go to: Behavior -> Site Content -> All Pages
Click on Page Title and search for “Error” in the filter field (the search term might be different according to your site URL structure).
Click on one of the results and you will get a lists of error URLs.
Using Previous Page Path or Source / Medium as a Secondary Dimension, you can find how the users got to that page.
It is also possible to set a custom alert to monitor the error pages when they go above a certain threshold.
5. Improve Site Performance with the Site Speed Report
The Site Speed report lists the most visited pages on your site and their Average Page Load Time as compared to the site average. A great way to break the data down is by using distribution charts.
The below report provides insights into how the Page Load Time (in seconds) is distributed and whether particular pages bring up the site Average.
Go to http://goo.gl/NbRGA5 and click on Distribution.
